Data Science and remote sensing: Water detection Part 2
Welcome back! This is the continuation of the previous blog on ‘Detection of water’ using satellite images. Read here if you haven’t done so already. As indicated in the previous blog, one will need Google Earth Engine(GEE) account in order to follow through the rest of this tutorial. Register for a free GEE account here
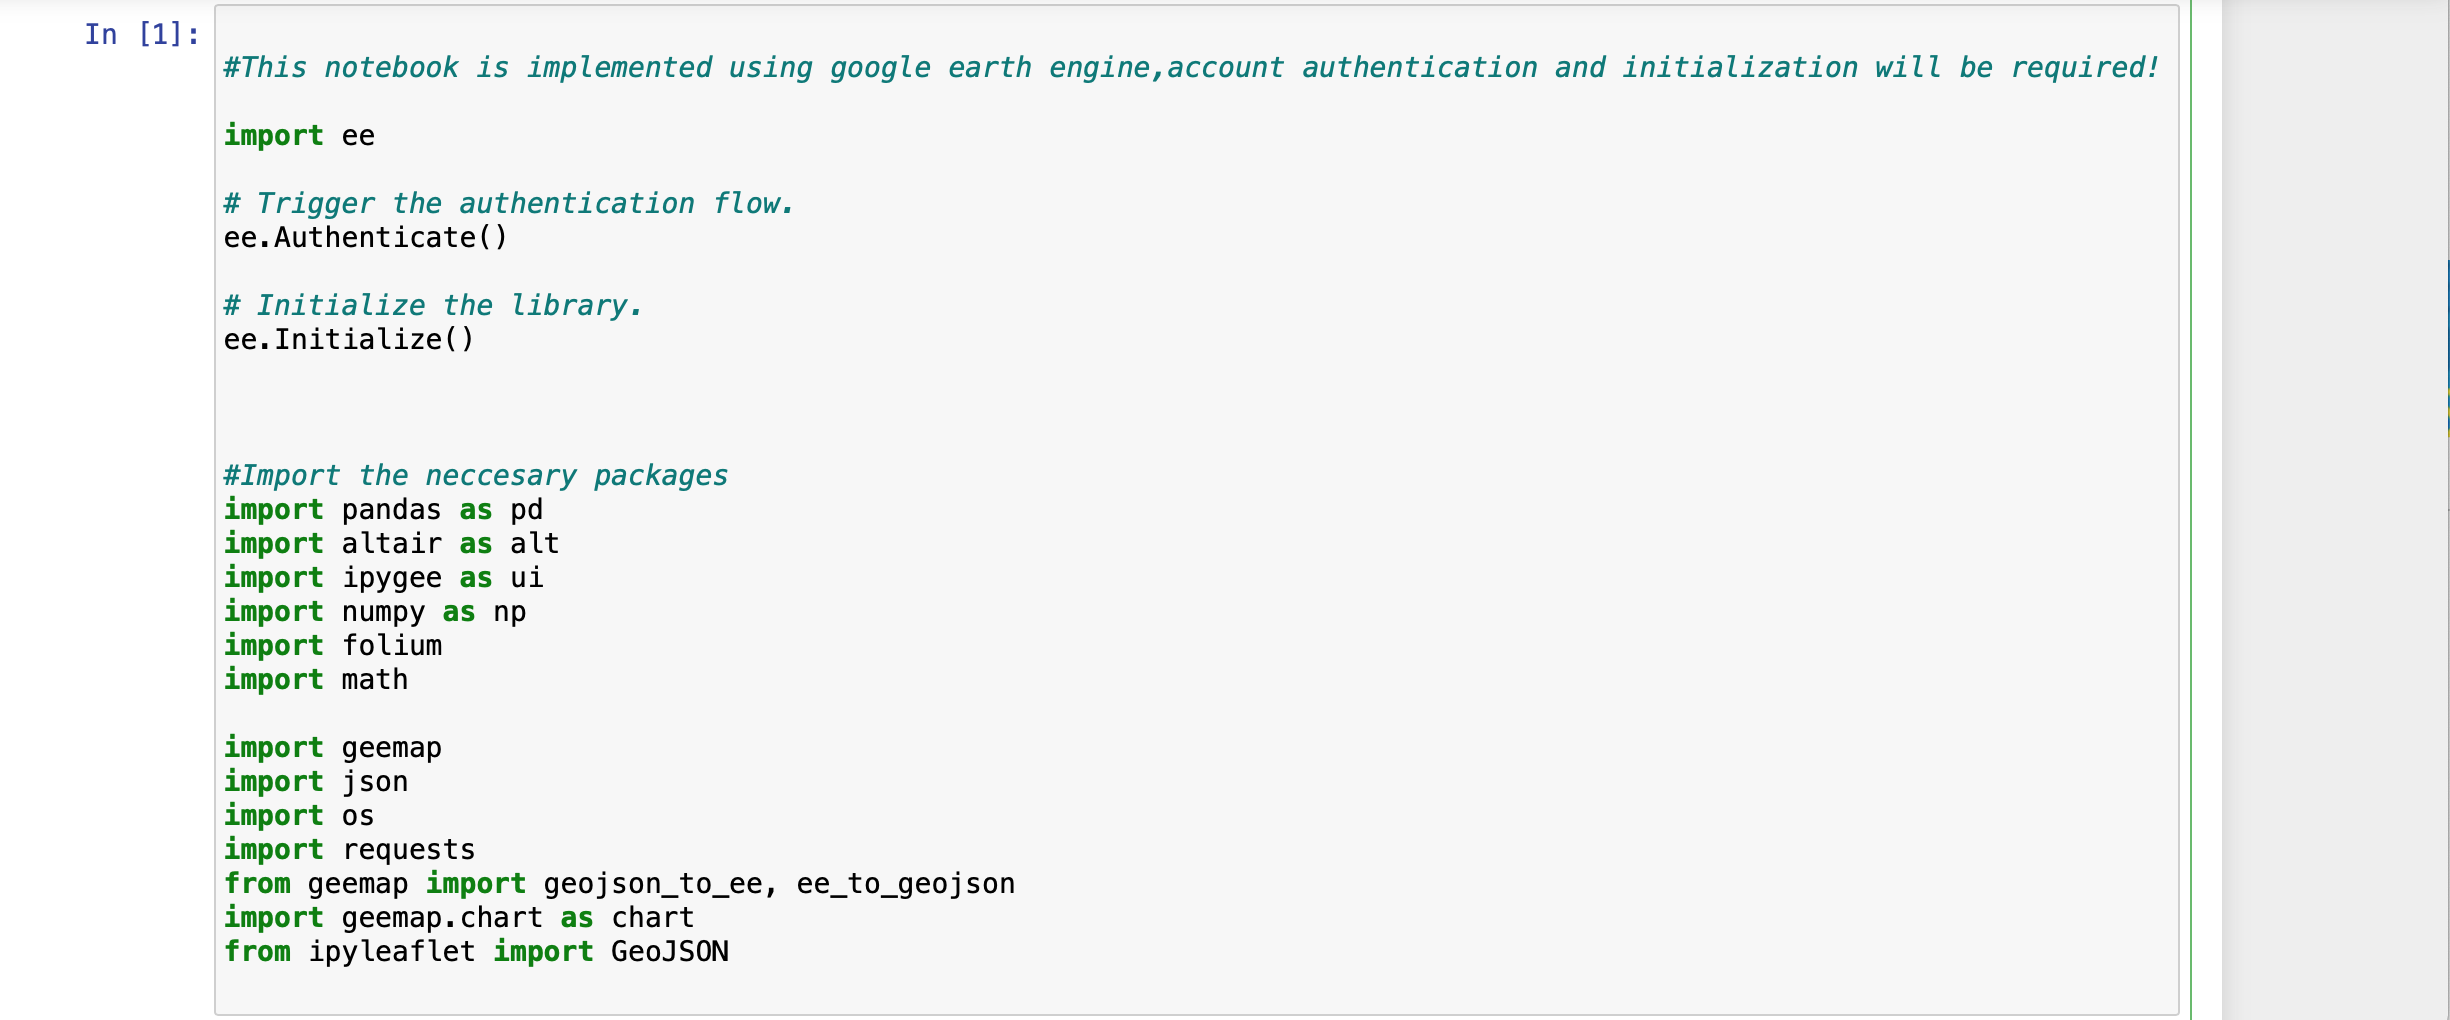
Next we load (import) all the necesary python modules into our jupyter notebook
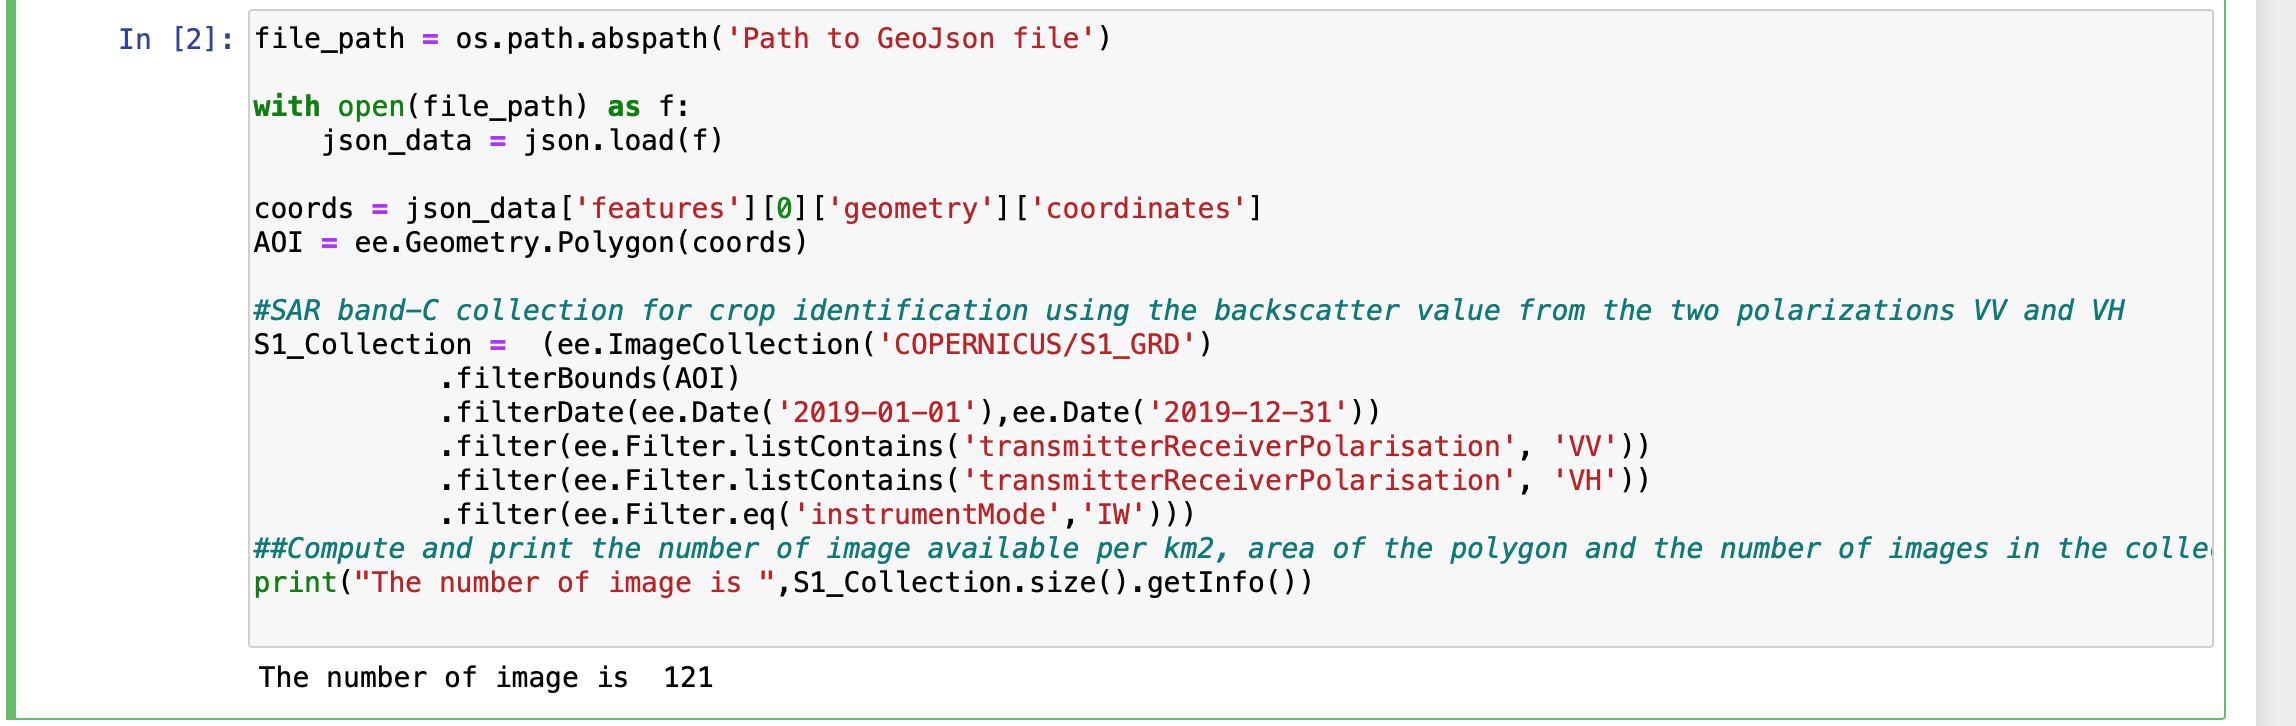
The next step is to define the Region Of Interest(ROI),i.e the area we want to collect satellite images over. To define your own ROI, you can use this tool. In case, you have your own shapefiles, here is a good place to upload them. As seen from the block codes below,there are few things worth noting; 1) convertion of geojson files into coordinate system that is understood by GEE, 2) specifing the satellite images to use for our analysis 3) filtering this satellite images based on filters such as date, transmitter polarization. We use the Synthetic Aperture Rader images (such as Sentinel 1) as it has some advantages over optical satellite images. Observing from the out in the cell, we can see that there are 121 images available for our ROI given the necessary filters
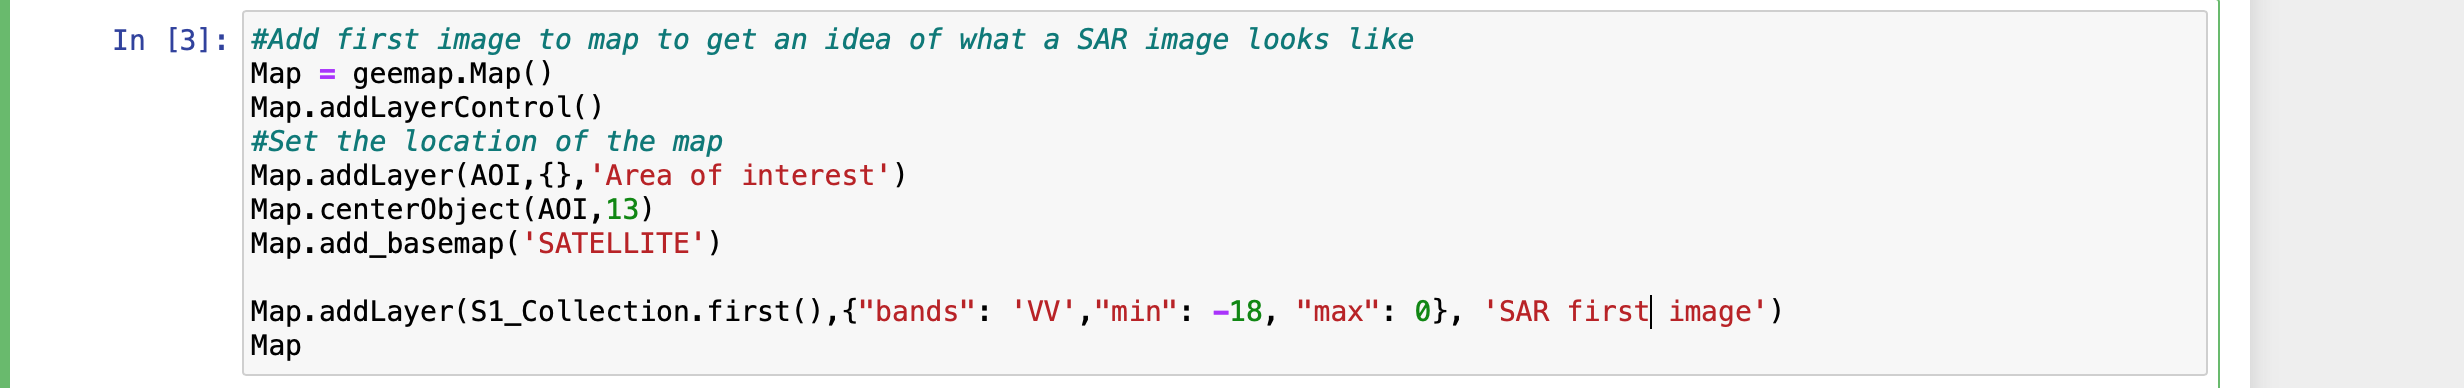
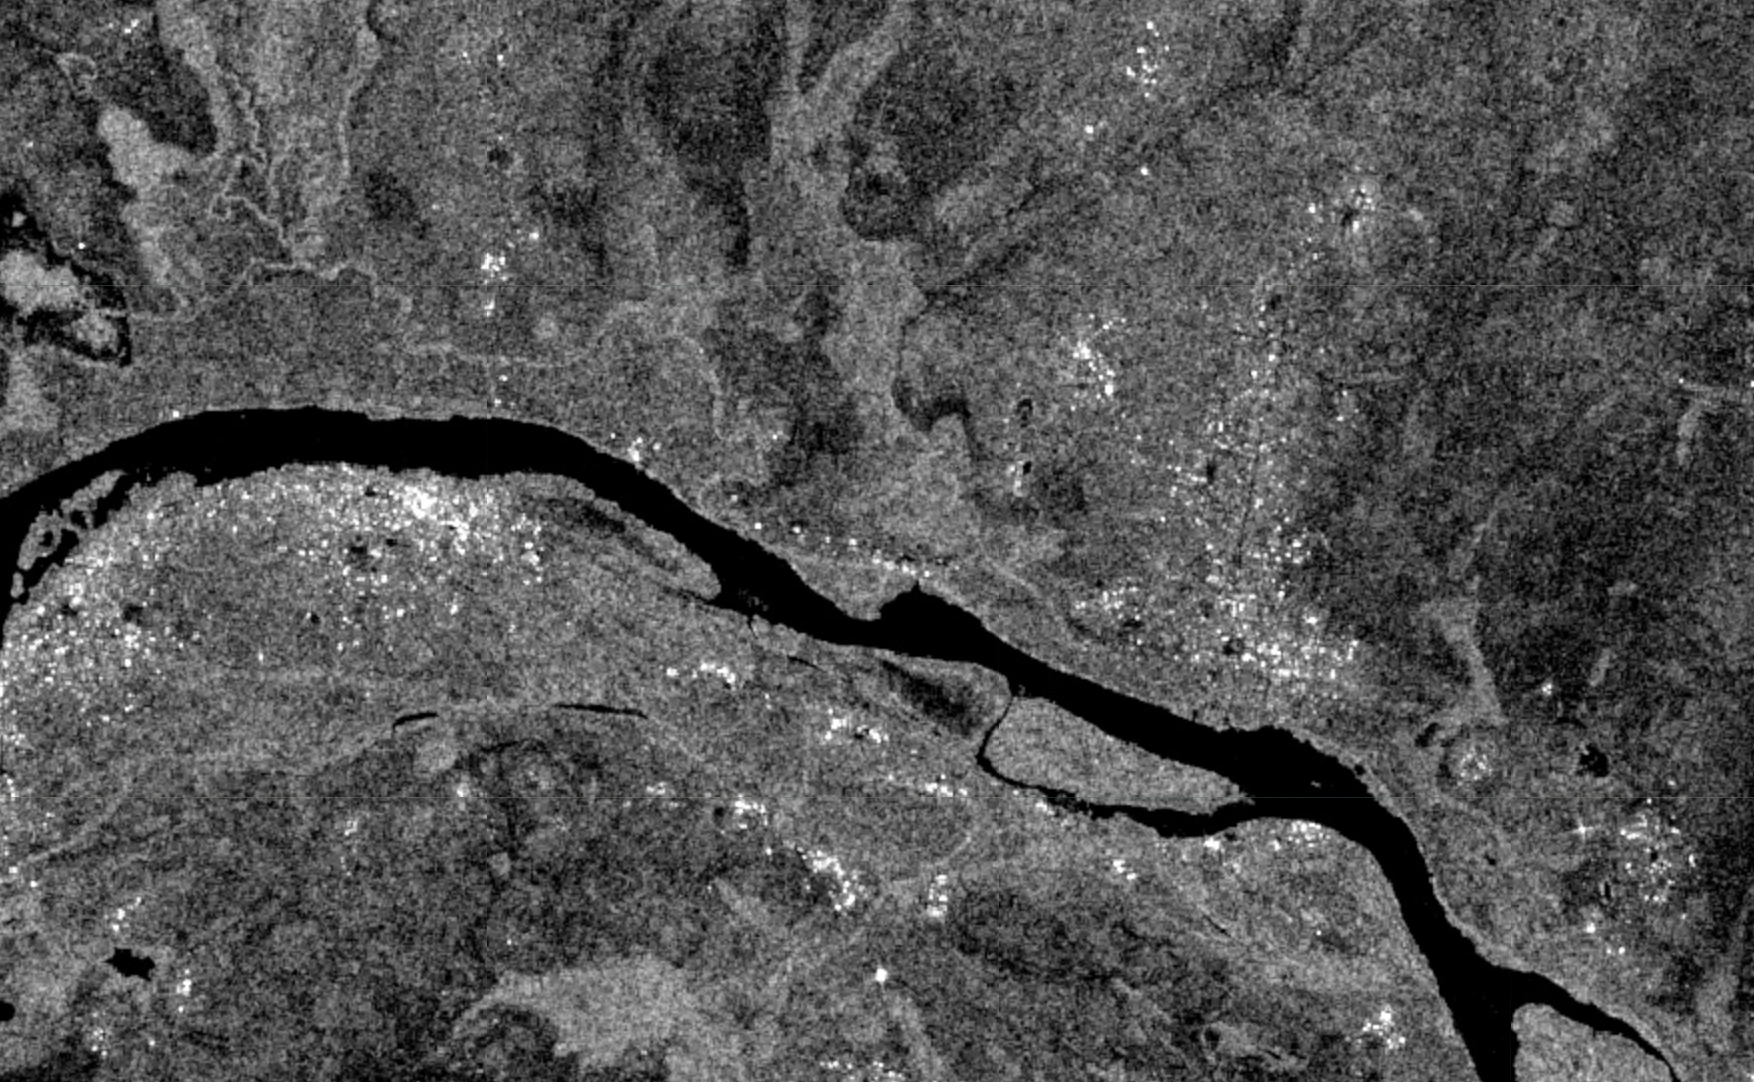
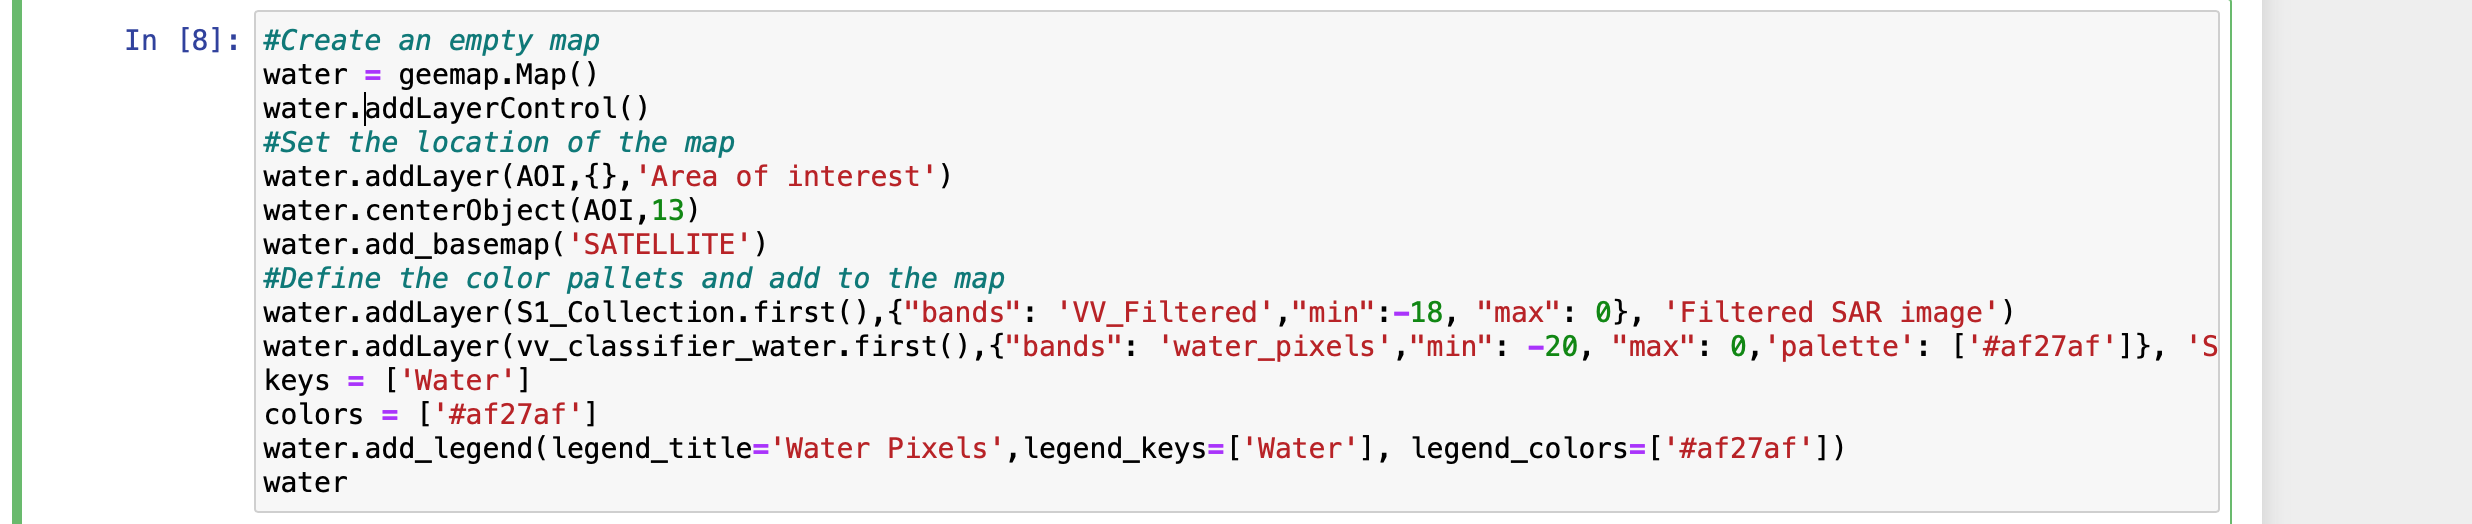
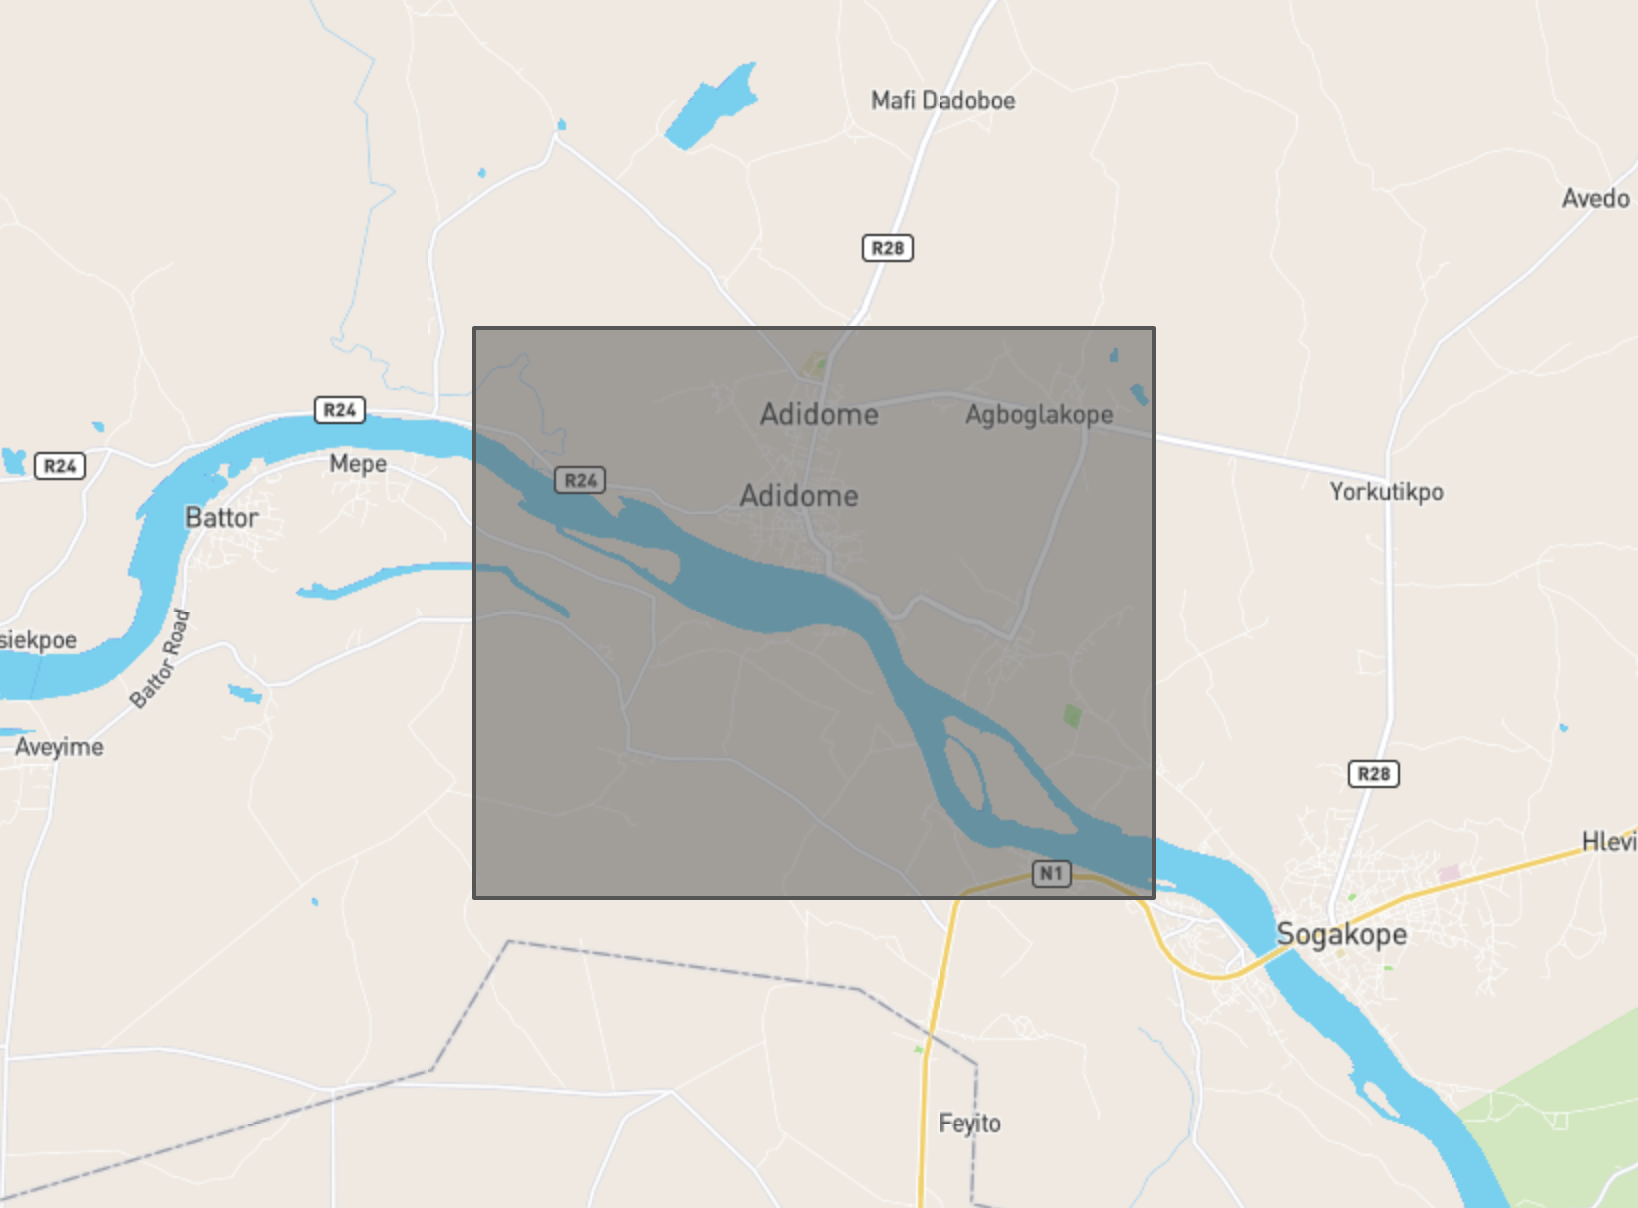 We look at the first image available in the entire collection (121). To do that we create a map of our ROI, display as a layer the first image.
The following block of codes creates a map using geemap of our ROI, then display the first image from the Sentinel 1 collection.
We look at the first image available in the entire collection (121). To do that we create a map of our ROI, display as a layer the first image.
The following block of codes creates a map using geemap of our ROI, then display the first image from the Sentinel 1 collection.
 The output of the above codes is shown bellow
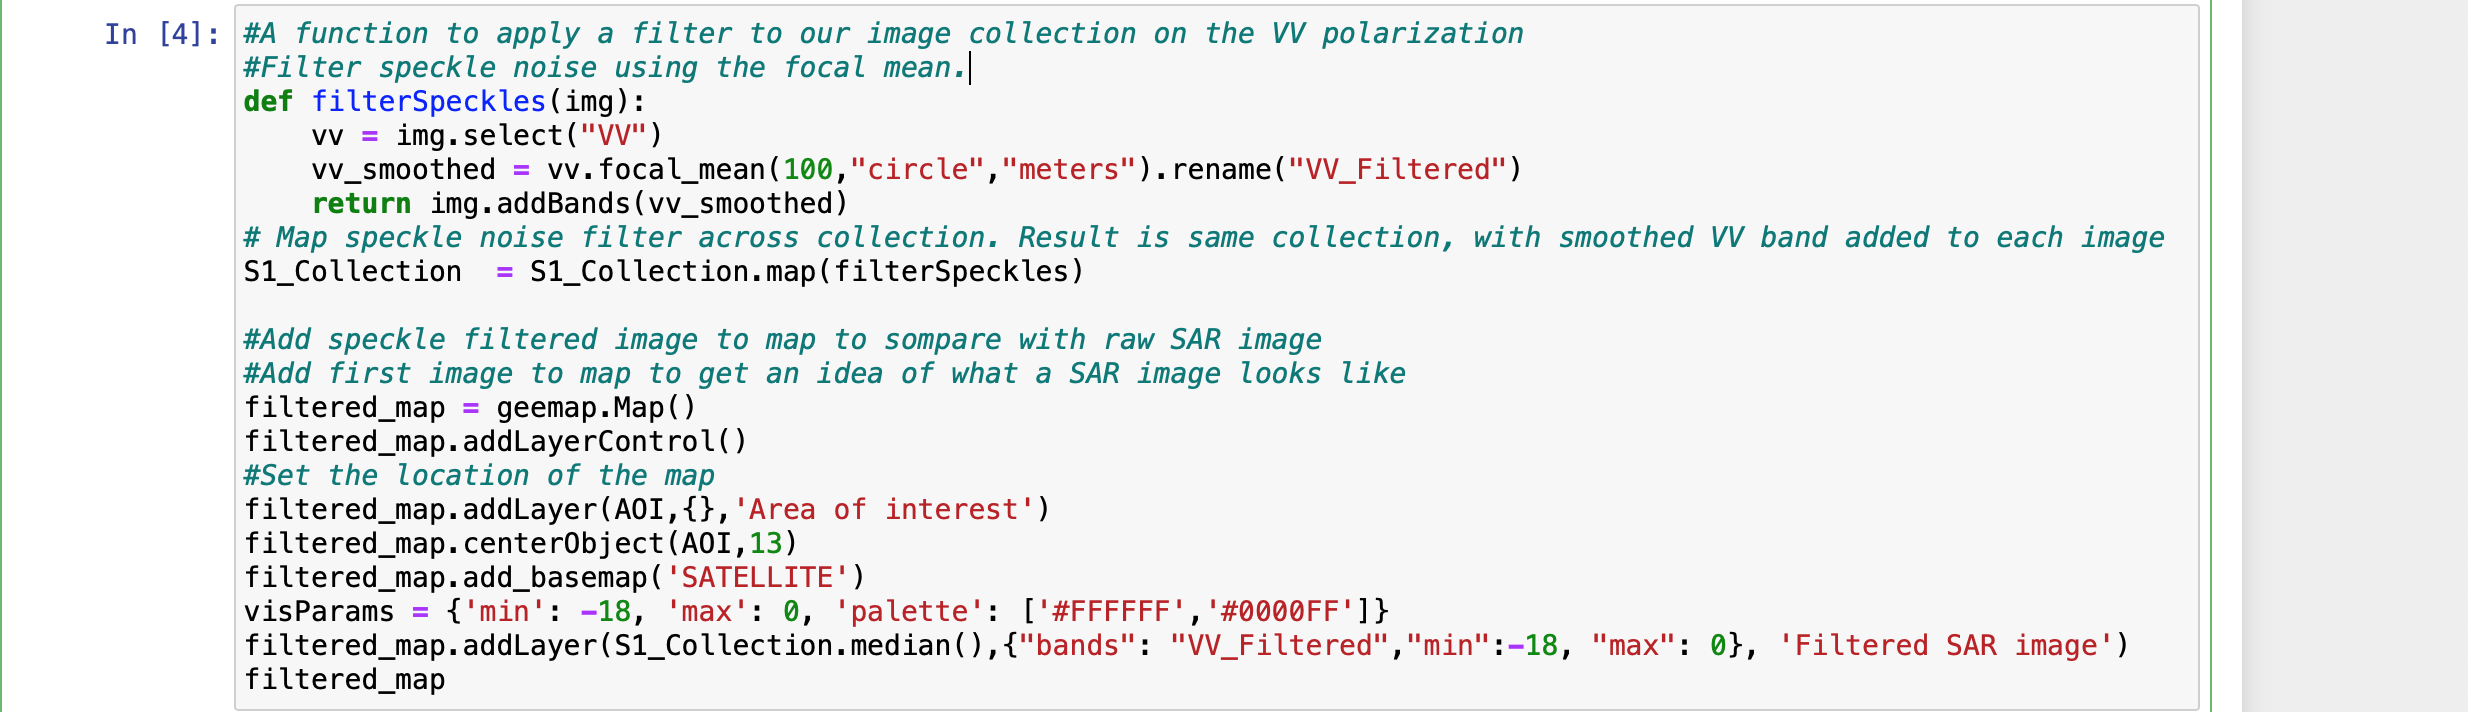
A major challenge working with SAR images is the speckle noise effect apparent in these images which degrades the quality of the images. Evident in the SAR image obtained are very bright tiny dots when you zoomed into the water body for example in this tutorial. Due to the very bright colors that are associated with objects such as land, SAR images turn to suffer from misclassifications when this speckle-noise is not treated. To remove the speckle noise from our images and make them ready for classification, we implemented the mean focal filter. This looks at the pixel from the entire image collection and the neighboring pixels and takes the mean. We then map this focal mean process across all images in the entire image collection.
Other approaches that could be used include the focal median filter, the Lee filter, refined Lee filter etc.
The implementation of the speckle filtering is shown below;
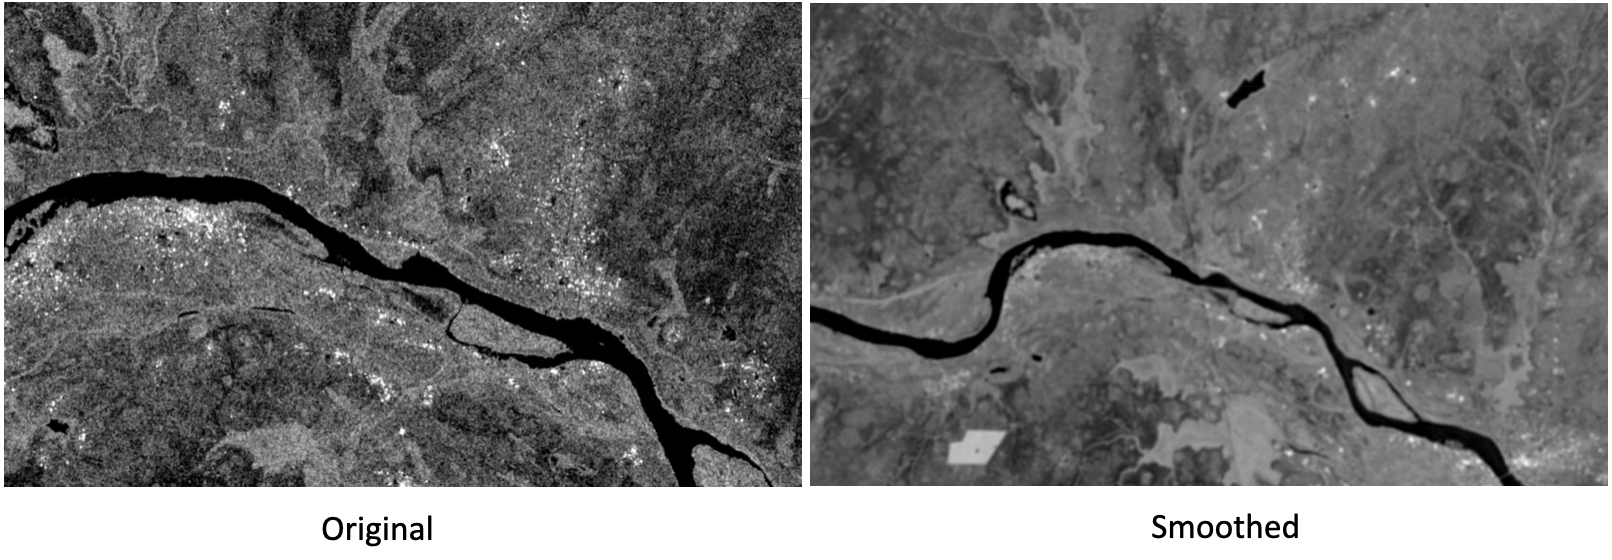
 Next, we look at the images obtained before the speckle noise reduction and after the noise reduction
RGB Composite
The images of our ROI so far has been boring, this because our eyes are naturally made to see colors. We combine the two(2) polarizatoins (VV and VH) of Sentinel 1 satellite to produce a more appealing view of our location. This color combination; Red, Green and Blue(RGB) which varies from satellite to satellite in terms of band combination is known as the RGB composite.
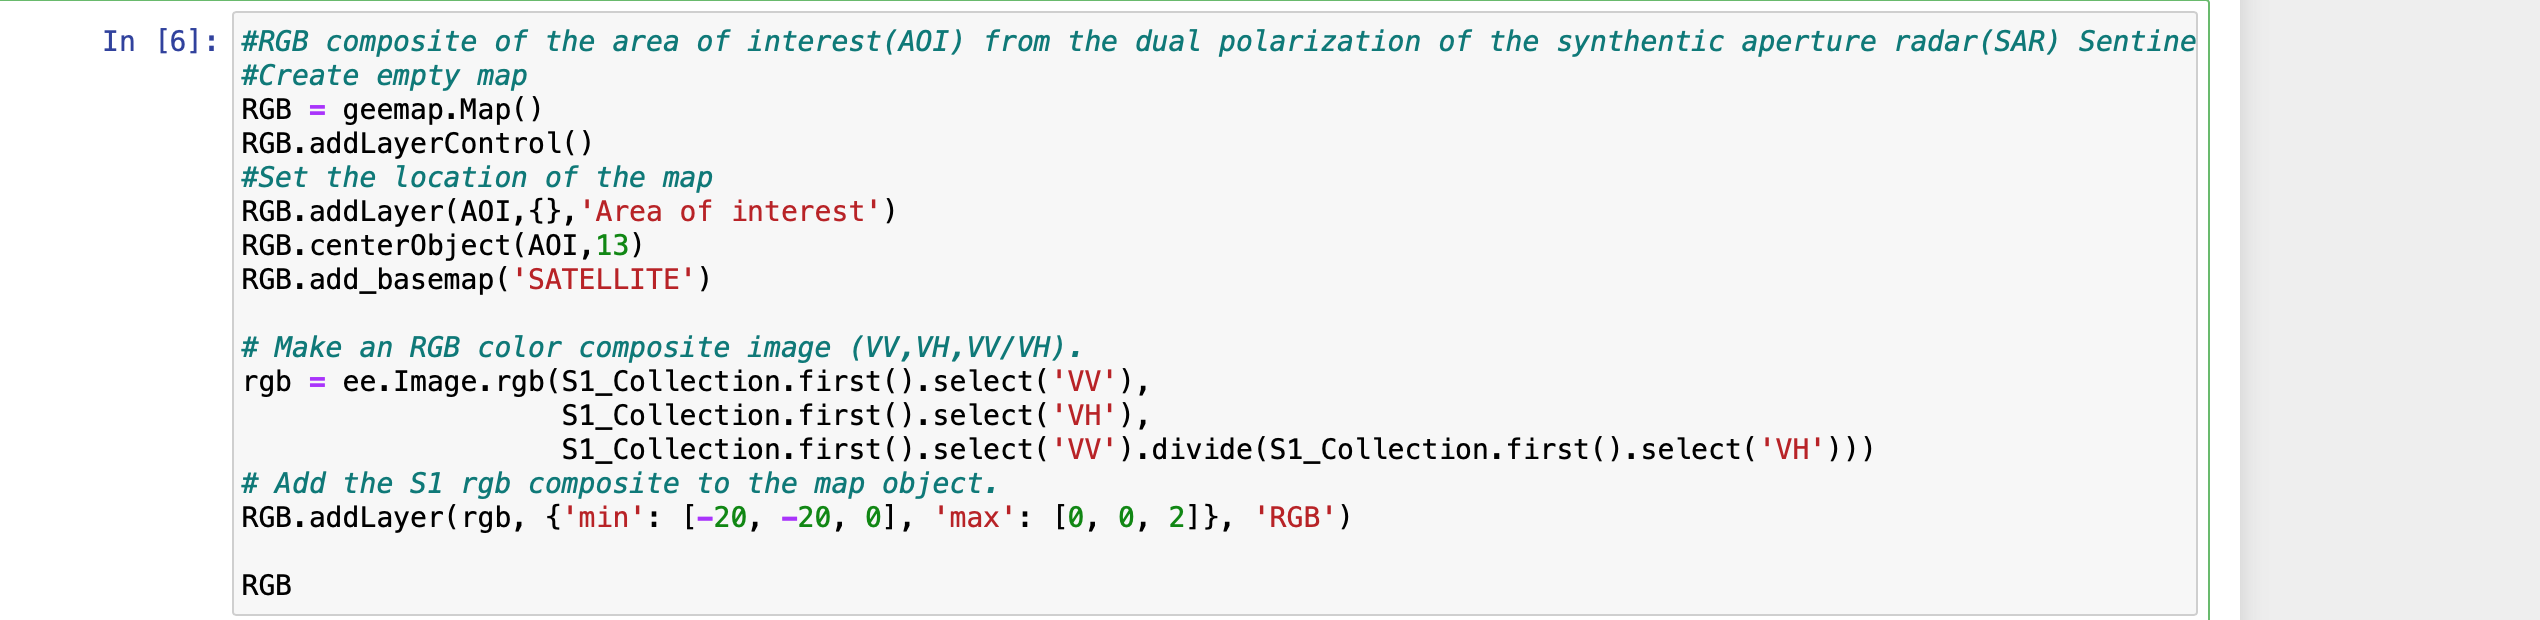
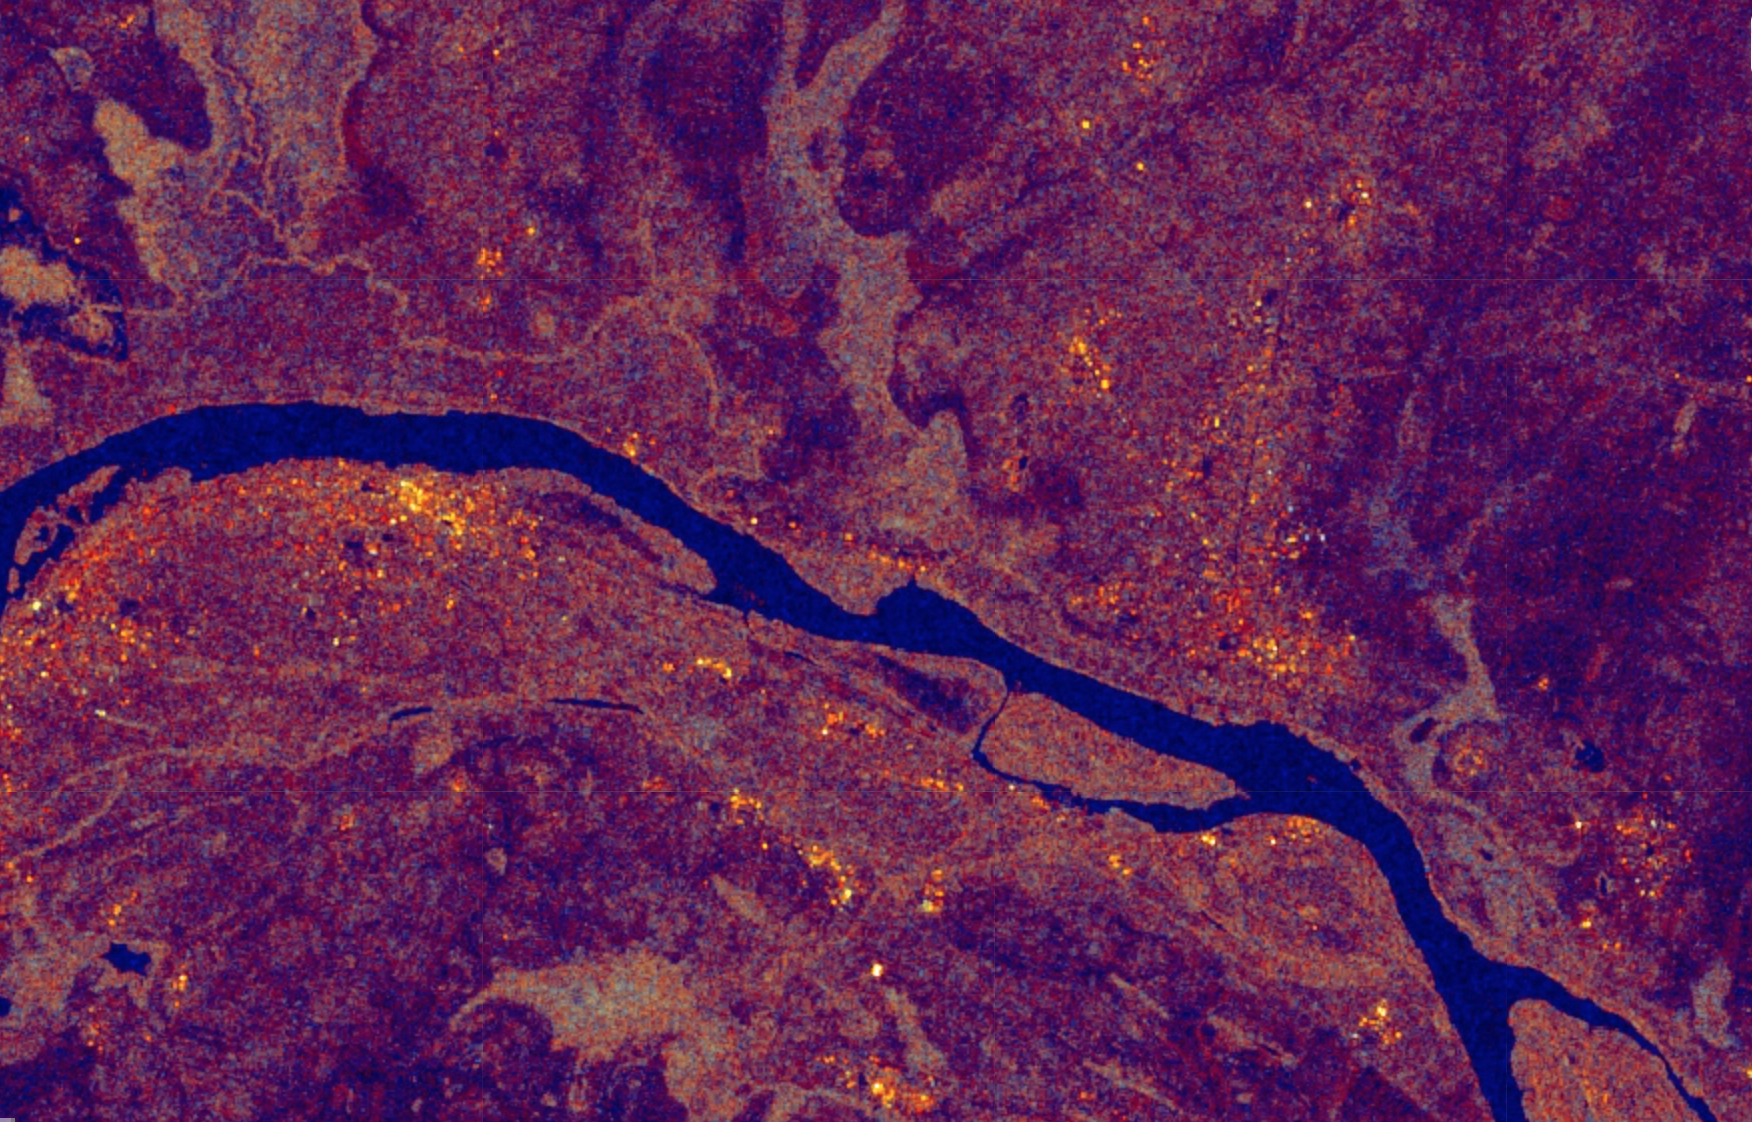 We have the RGB color composite over our ROI; now we are happy!
Water area classification
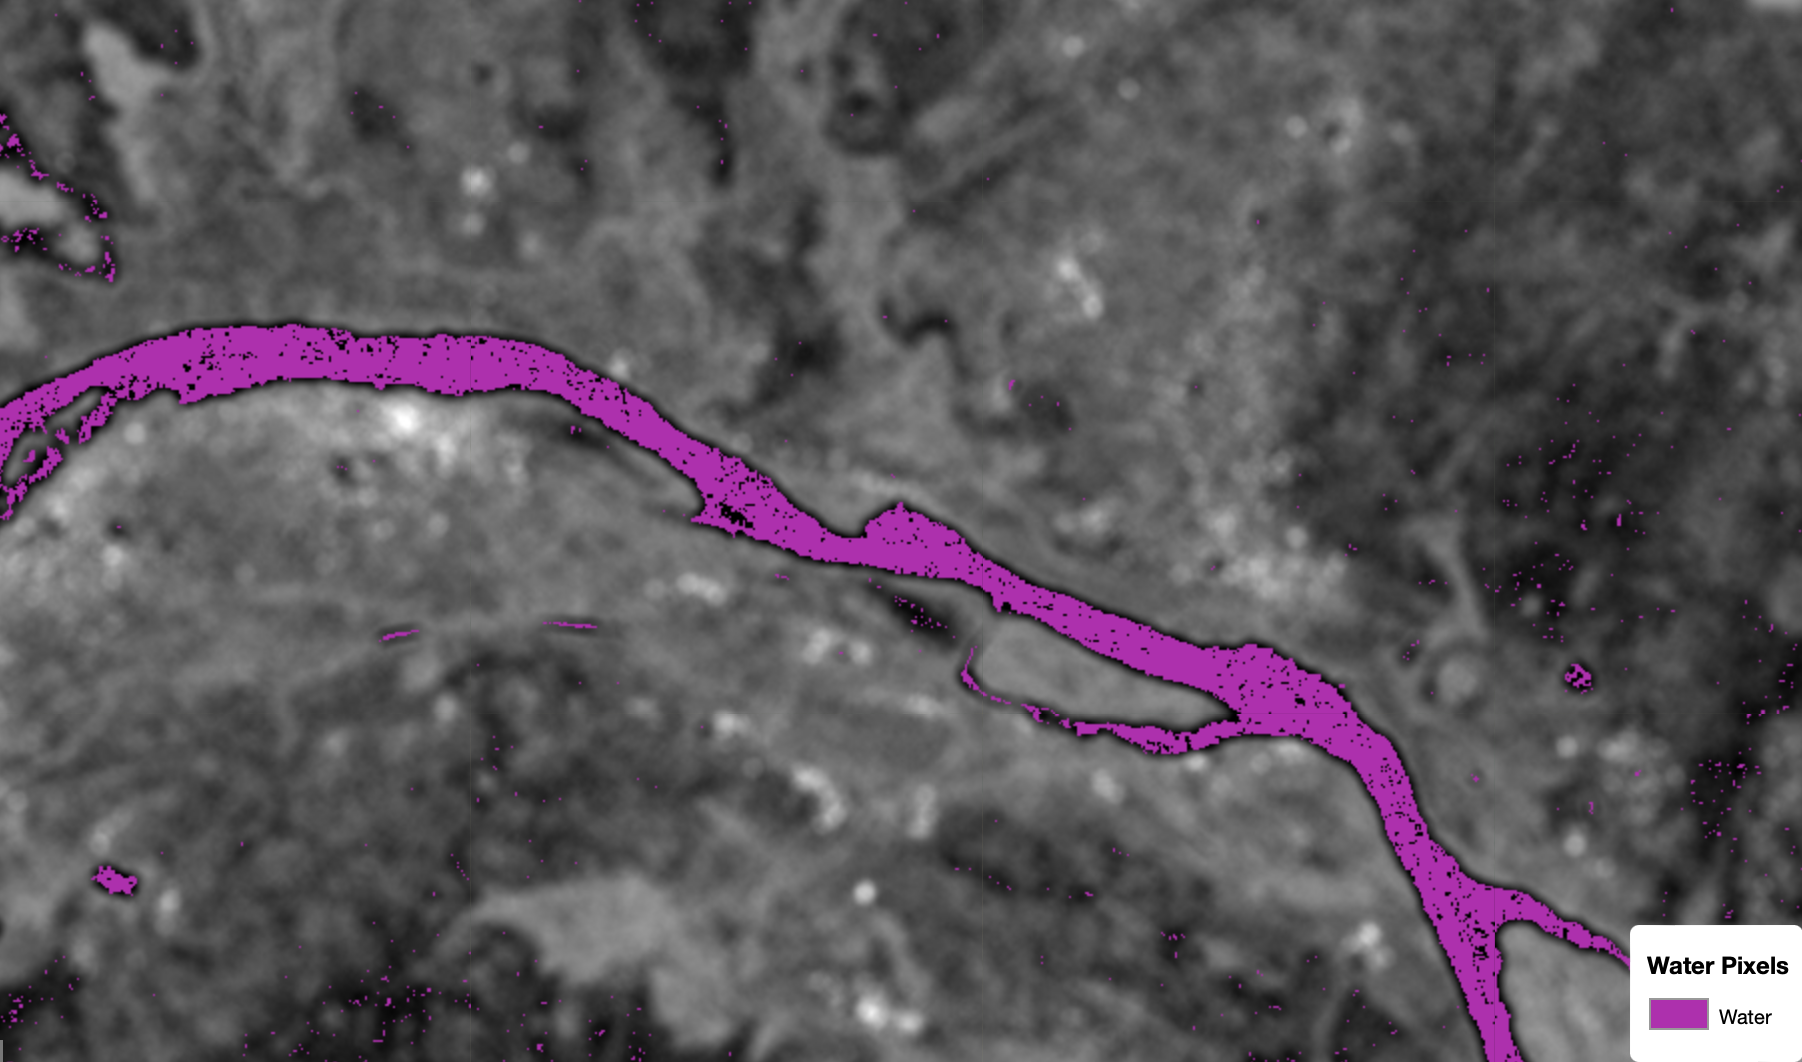
Satellite signal( Sentinel 1 in our case) hits and scatters from the earth surface. The amount of signal scattering from the surface (backscatter) is dependent in part on the type and texture of the surface, with smooth surface scattering less. Flat surfaces like water scatter very little; as a result, the stand out as dark spots against relatively very high scattering from land surfaces.
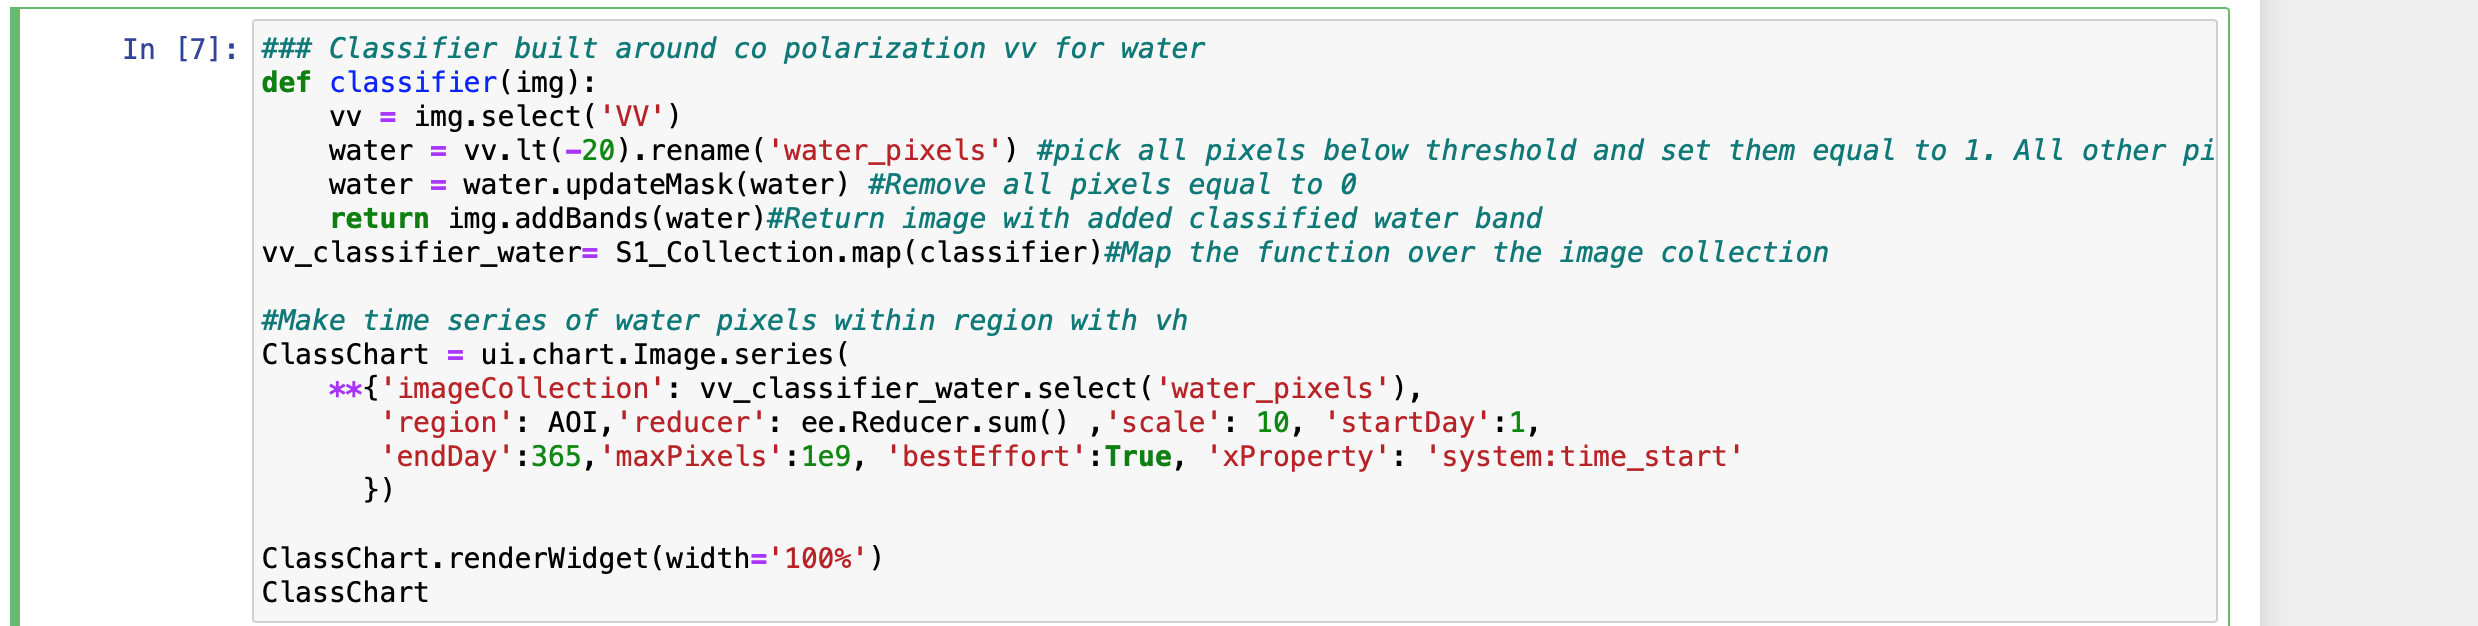
To classify the water pixels in our ROI, we use a threshold approach. Since water bodies gives a very low scattering value, it gives darking pixels which are easily distinguishable from the land pixel; which appears very bright. The approach involves picking a threshold of backscatter value, all pixels below this threshold is classify as water. For this tutorial, we use -20 as our threshold backscatter value to estimate water area. Feel free to adjust this threshold and see how your classification changes for your location. It is important to note that the value used here is simply based on heuristics and as such, a more optimal thresholds can be determined through a more robust mathematical or statistical techniques. The goal of this tutorial is to demonstrate how the backscatting value of Sentinel 1 could be used to detect various ground objeects such as water.
Time series of water pixels
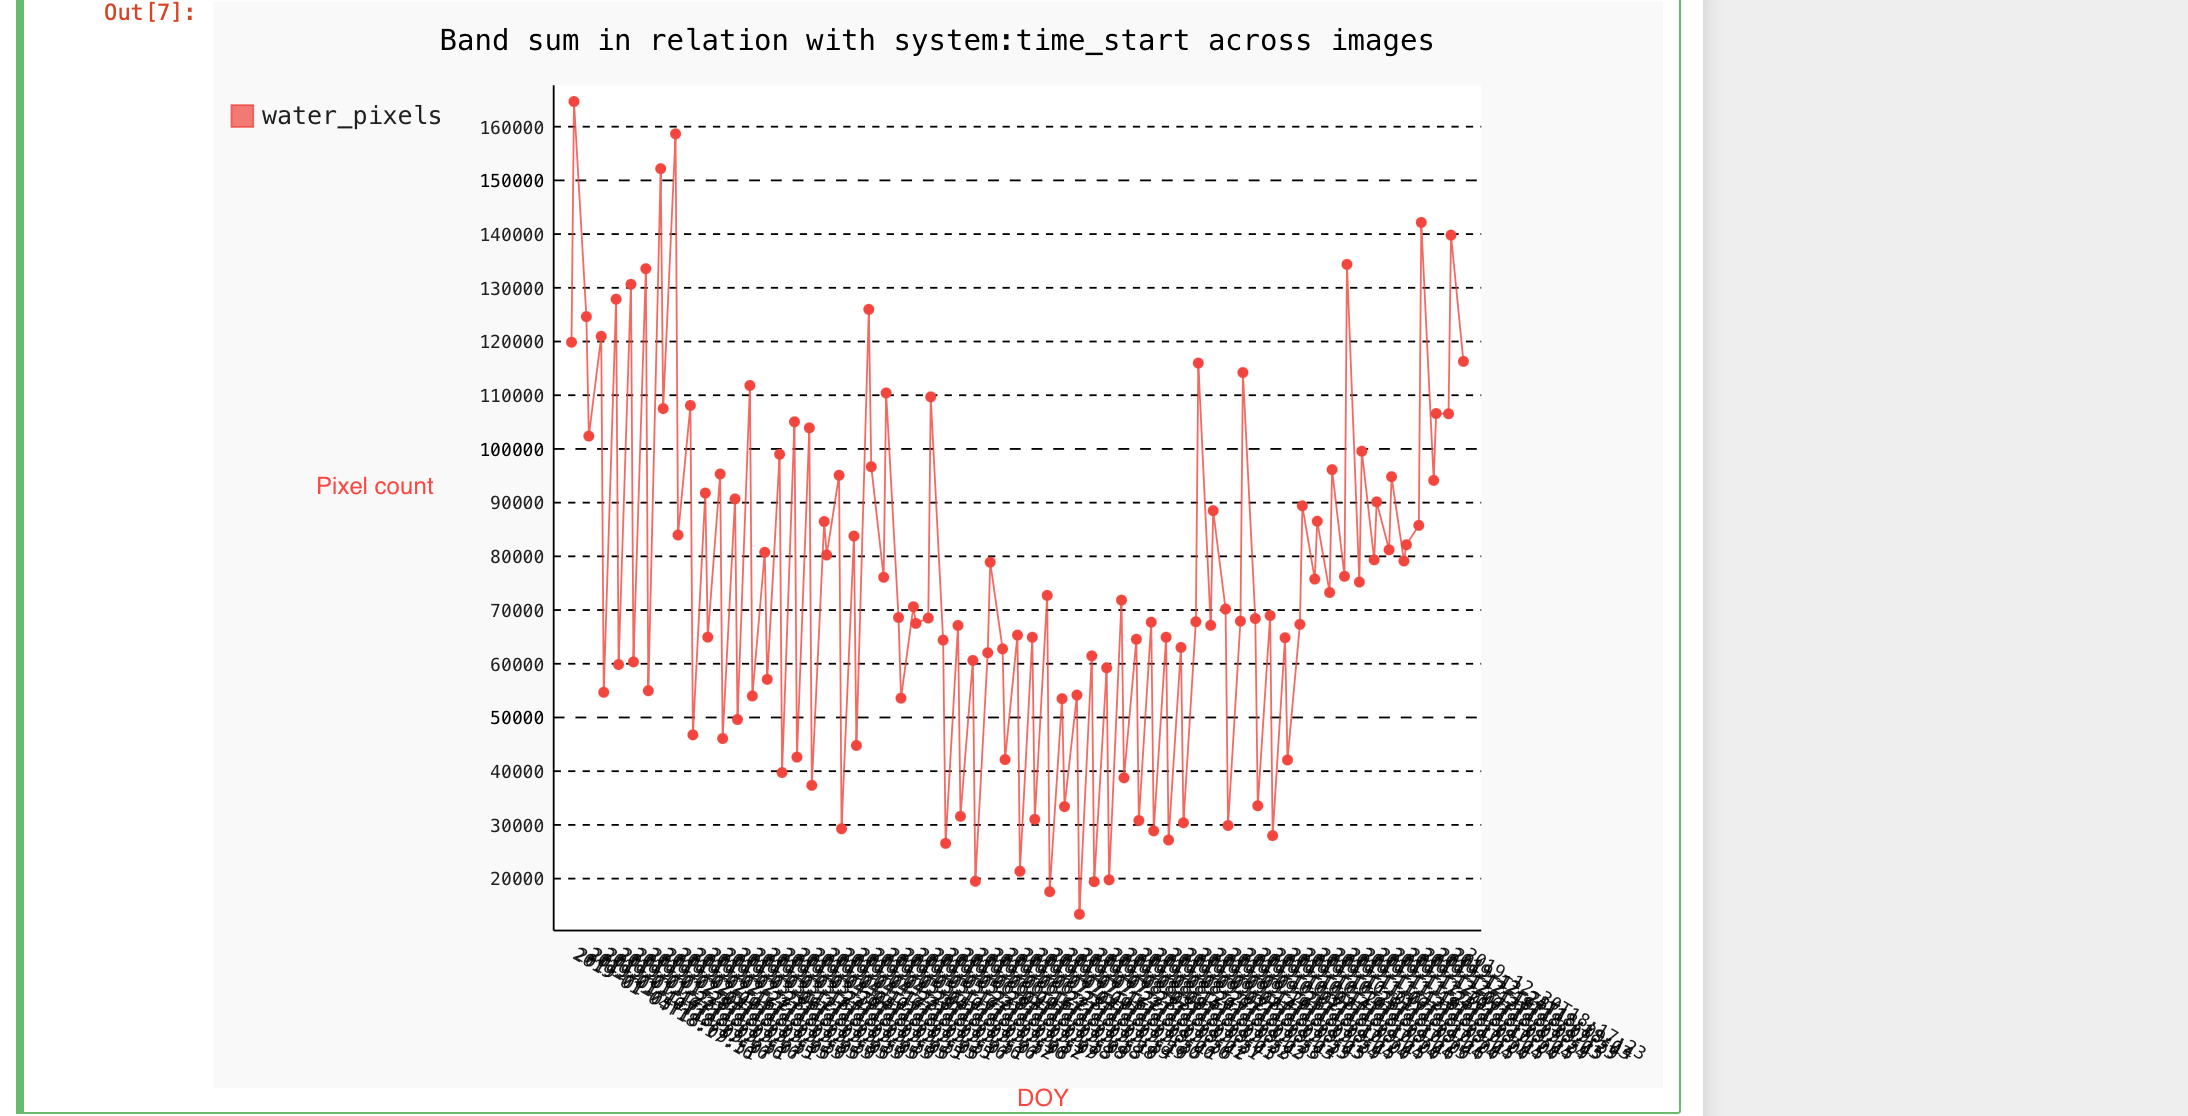
Next, we show the time series of water pixels in our region of interest. We create a chart that shows a spatial sum reducer across the image collection. This sum reducer ‘sums’ all pixels corresponding to water in the region at each time step. We set the scale to 10m (the resolution of Sentinel 1) in order to reduce the missclassification error, however this may result in taking a longer computation time. Again, try changing this scale from the native resolution to say 100m and compare the computation time and the classification!
 Your chart should look like this if you follow through this tutorial!
Finally, we show the water classification on the map!
 Don’t forget to give me an upvote and comment when you find this useful, cheers!!!
Hi. I am Bright Aboh; a data scientist, a climate change researcher and a music lover.