Harmattan through satellite lense
1 Introduction
Harmattan is a north eastern (wind direction is mainly north east) trade dry and dusty winds that blows from the south of the Sahara towards the Gulf of Guinea. These trade winds are considered to be seasonal as they blow from November till March . With such dry winds, the relative humidity usually hovers around <10% , temperatures usually fluctuates a lot during this period with cold night temperatures ranging from 9-20 Celsius. During the day however, temperatures could go as high as 30-39 Celsius depending on the location !
1.1 Harmattan haze
A very common noticeable phenomena associated with harmattan is the presence of grey skies (hazy skies) which normally blocks the sun’s rays creating a low visibility! This haze phenomenon is caused by the presence of huge dust particles in the atmosphere!
1.2 Formation of harmattan haze and/or dust storm
When wind blows over the open desert area, it carries with it a lot of dust particles from the ground. The very small dust particles ranging from sizes 0.5 microns to 10 microns suspends in the air . These suspended particulate matter are transported over great distances by this wind . When the air movement is strong enough, it could lead to huge sand storms.
During the harmattan season, there is a lot of dust in the atmosphere in many west African countries causing haze in the atmosphere among other effects. So which countries in Africa are mostly affected by this harmattan? These countries include; Niger, Nigeria, Chad, Ghana, Burkina Faso, Benin, Mali, Ivory Coast, Togo and Cameroon.
1.3 Effects of harmattan
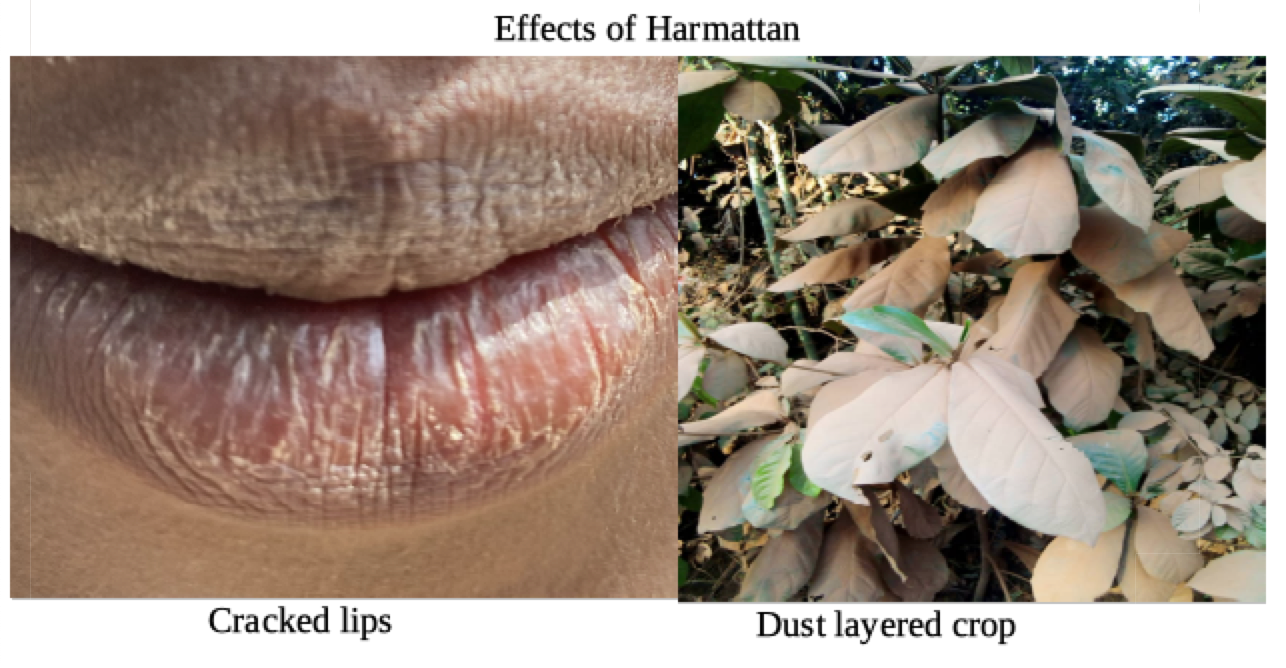
Strong and persistent harmattan can destroy crops due to the large dust layer on these leaves and lack of rainfall causing some famers to experience crop failures.
The high amount of dust in the atmosphere limits visibility greatly in some West African countries. As a results, the aviation industry suffers some great loses as some have their flights cancel or interrupted each year due to harmattan.
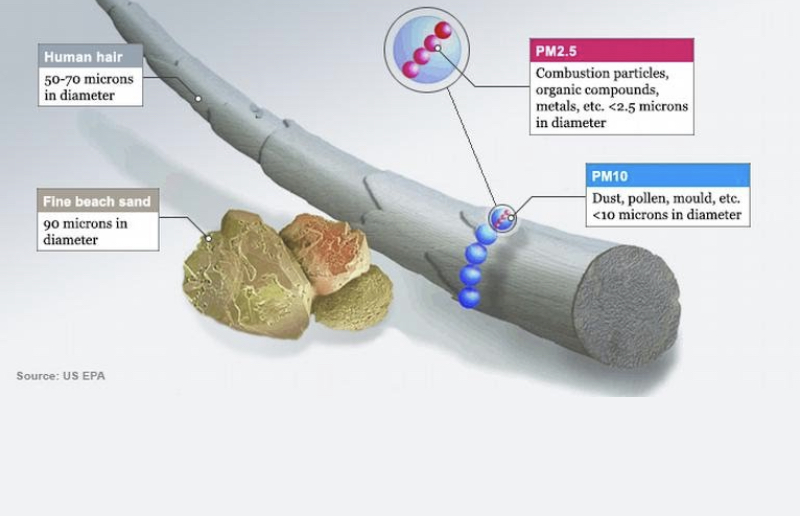
Among the numerous effects of harmattan, public health implications of harmattan cannot be overemphasized. Some of the health concerns usually associated with this period are irritating eyes, cracked lips, craked soles, very harsh weather etc. More serious concerns such as meningitis(Sahel meningitis), asthma and other respiratory problems are often associated with the harmattan season. Since the sizes of the particles are very small, they are easily absorbed into the respiratory truck and the lungs sometimes thereby causing/worsening cardiovascular diseases and other health disorders. For the purpose of further understanding and analysis, these particles are grouped based on their sizes with PM 2.5 (Particulate matter with diameter less than 2.5 micrometers) and PM 10 (Particulate matter with diameter less than 10 micrometers) generally considered fine inhalable particles and inhalable particles respectively. The figure below provides some insight on the particles! As seen from the figure, these dust particles could be so small (smaller than the human hair) such that they could cause serious health implications when inhaled.
1.4 Other winds of Africa
It is worth mentioning that aside the harmattan winds, there are other major winds on the African continent . These include; Sirocco: Hot, dry wind that brings dust and from Tunisia and Algeria to the Mediterranean and Southen Europe. Ghibli: Hot, dry south wind blowing from Libya towards Greece, khamsin, Haboob, Cape Doctor, Levanter etc.
2. Data description
In this tutorial, we will use the Sentinel -5Precursor Near Real Time (NRTI) UltraViolet Aerosol Index (UVAI) also known as the Aerosol Absorbing Index(AAI). The Sentinel-5Precursor is part of the sentinel’s earth observation satellite mission launched by the European Space Agency collect remotely sensed atmospheric data mostly on air pollution
The AAI is defined as the difference between the ratio of measured reflectance at 354 and 388 nm and the ratio of simulated reflectances at these wavelength depending on the changes in Rayleigh wavelength scattering.
Mathematically;
When the AAI value is positive, it indicates the presence of UV-absorbing aerosols like dust and smoke. This index is useful for tracking the evolution of episodic aerosol plumes from dust outbreaks (such as harmattan), volcanic ash, etc.
For further reading, interested readers should contact the official documentation here
3. Goal
In this tutorial, we will monitor the progression of the trade winds responsible for the dust storms experienced during harmattan period with the help of satellite images. In particular, we will monitor when these dust reaches Ghana from the Sahara desert (dust origin). We used python programming language and Google Earth Engine as data source and computational platform
4. La crème de la crème
To start with, we import the necessary modules and packages!
import ee
# Trigger the authentication flow.
ee.Authenticate()
# Initialize the library.
ee.Initialize()
#Import the neccesary packages
import geemap
import json
import os
import requests
Next be define the our area of interest.
AF_region = ee.Geometry.Polygon(
  [[[-18.698368046353494, 38.1446395611524],
    [-18.698368046353494, -36.16300755581617],
    [52.229366328646506, -36.16300755581617],
    [52.229366328646506, 38.1446395611524]]],
  None, False)

mask = ee.FeatureCollection('USDOS/LSIB_SIMPLE/2017')
africaBorder = mask.filter(ee.Filter.eq('wld_rgn', 'Africa'));
ghanaBorder = mask.filter(ee.Filter.eq('country_na', 'Ghana'))
Start the image collection and filter them based on the area of interest and dates. The idea is to create an animation with the images so as to observe the dust movement. To achieve this, we start our image collection some few months before the begining of harmattan specifically in August
#Collect Sentinel 5P NRTI satellite images
dust = ee.ImageCollection('COPERNICUS/S5P/NRTI/L3_AER_AI') \
.select('absorbing_aerosol_index')\
.filterBounds(AF_region)\
#Save the images separately based on the filter date
.filterDate('2021-08-01','2021-08-30')
#.filterDate('2021-09-01','2021-09-30')
#.filterDate('2021-10-01','2021-10-31')
#.filterDate('2021-11-01','2021-11-30')
#.filterDate('2021-12-01','2021-12-31')
#.filterDate('2021-01-01','2022-01-15')
Save the image collections locally. Next use the images to create an animation using this online tool
The resulting animation shows dust movement from August to January in the sahara region
#Save the image collection locally
out_dir = os.path.join(os.path.expanduser('~'), 'Downloads')
filename = os.path.join(out_dir, 'dust_collection.tif')
geemap.ee_export_image_collection(dust, out_dir=out_dir)
# A function to clip the image collection to the area of interest
def func_onv(img):
    return img.clip(africaBorder)

dust_test = dust.map(func_onv)
dustImage = dust.mean()# find the mean image(to be added to the map)
#Define the visualization parameter
val_max = 2.0
val_min = -1
band_viz = {
  'min': val_min,
  'max': val_max,
  'opacity': 0.55,
  'palette': ["#000000", "#0000FF", "#800080", "#00FFFF", "4C9A2A", "#FFFF00", "#FF0000"]
}

# Now map the visualization parameters over the collection
def func_cyl(image):
    return image.visualize(band_viz) \
  .map(func_cyl)
Display the mean image on the map
 Map = geemap.Map()# Define an empty
 legend_dict = {"-1": "#000000", "-0.5":"#0000FF",
               "0" :"#800080", "0.5": "#00FFFF",
               "1":"4C9A2A", "1.5": "#FFFF00",
               "2": "#FF0000"} #Map legend
clippedImage = dustImage.clip(africaBorder)
Map.centerObject(africaBorder,6)
Map.addLayer(clippedImage, band_viz, 'Clipped Image'); # Add image to the map
Map.add_basemap('HYBRID')

Map.add_legend(legend_title= "Aerosol index",legend_dict=legend_dict)
Map.addLayerControl()
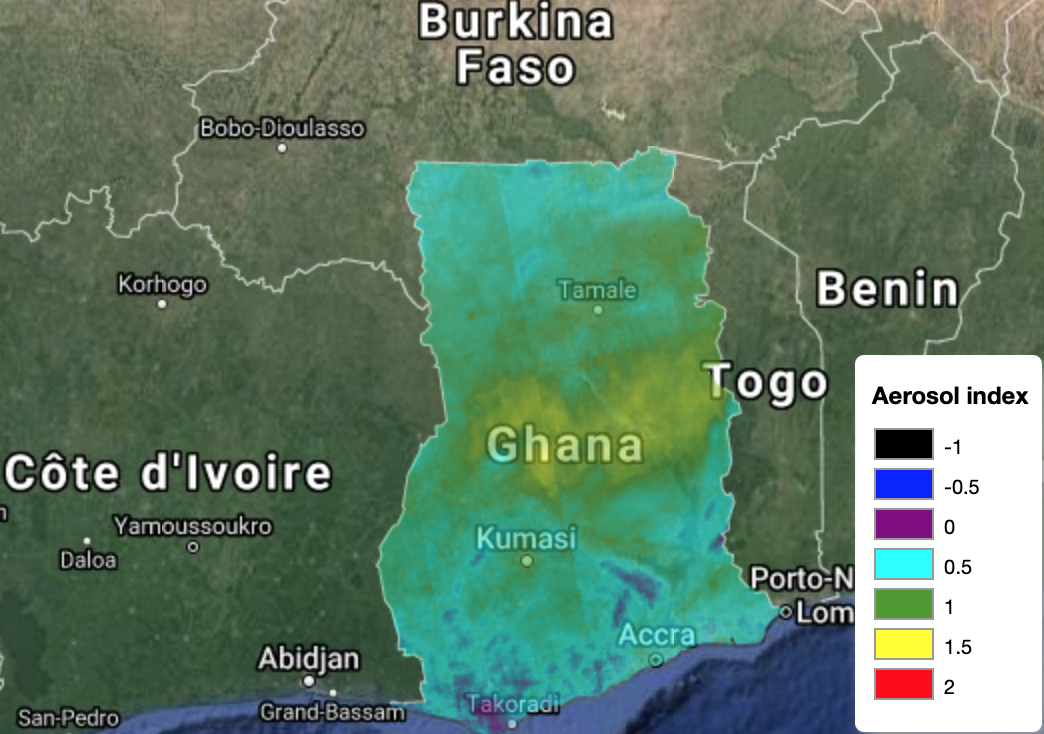
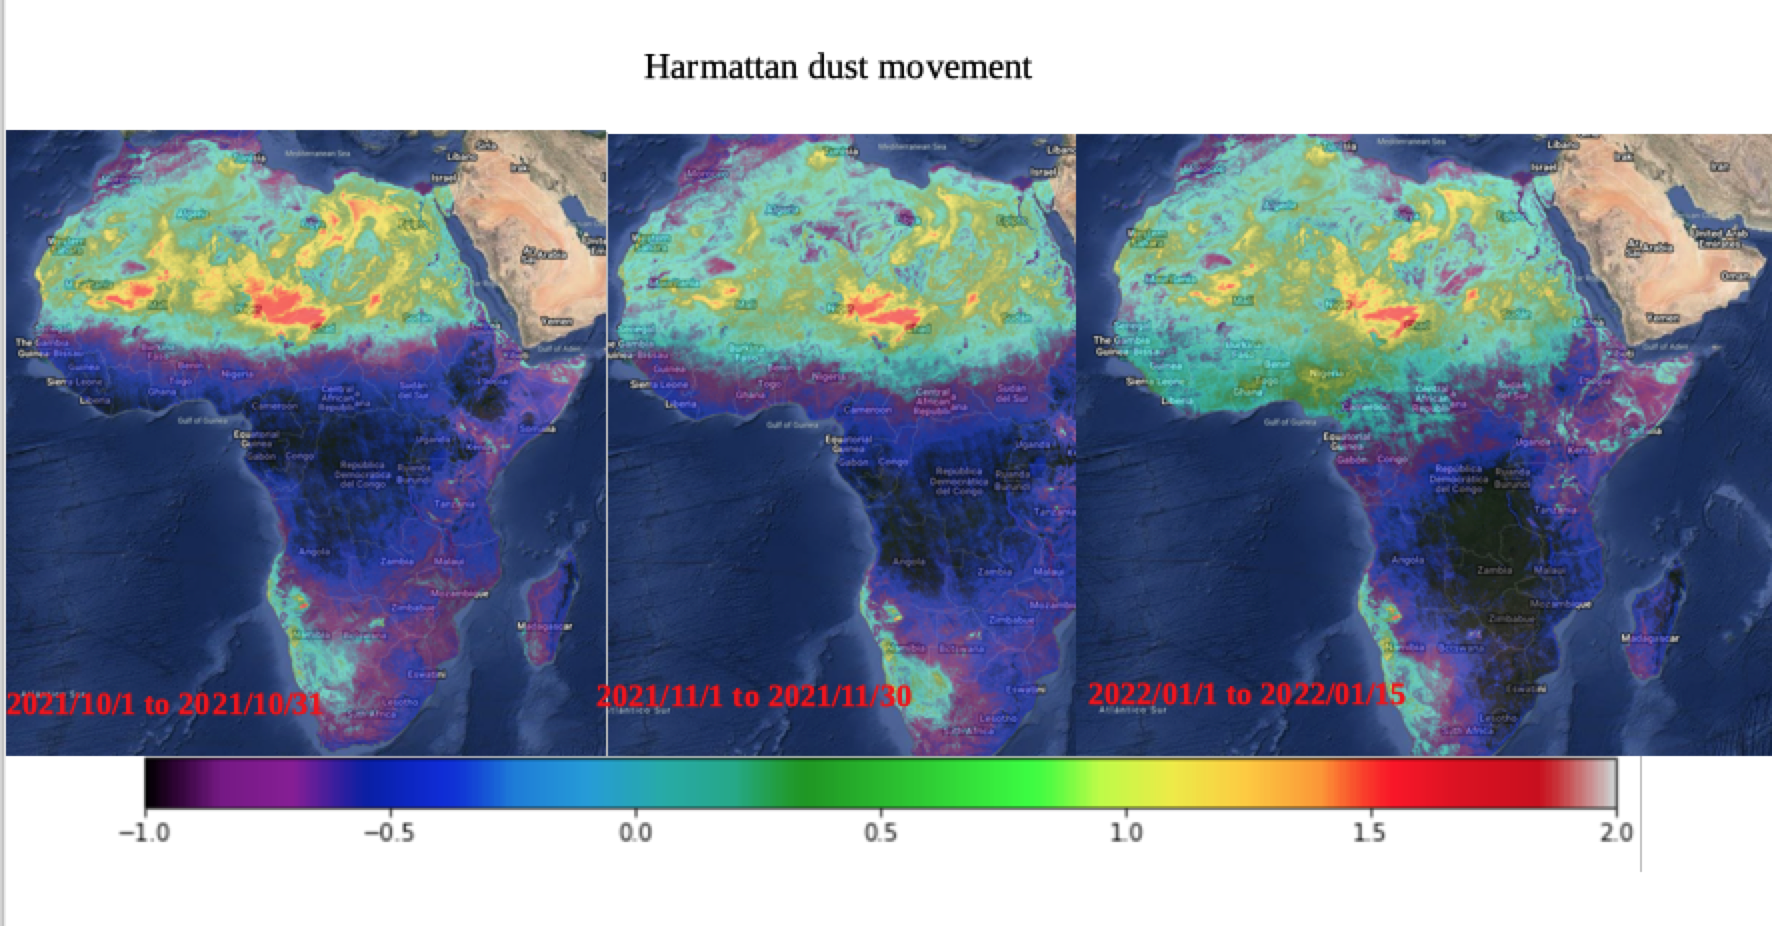
So how do the countries affected by harmattan look at the time of writting(January 15) this post? From the figure below, we observe a huge aerosol(dust) hovering over these countries barely 2.5 months into harmattan. The left image taken one month into harmattan shows movement of dust from sahara towards the affected countries. In the right image however (January 1-15), we observe progression of the dust into affected countries. The legend indicates the presence and severity of this dust. Positive values from 0.5(colored in cyan) indicates presence of dust and 2 (colored in red) indicates the worse case senerio (presence) of the dust
 Next, we observe when this dust reaches the shores of Ghana from space. We use the same approaches as before, but we set the boundaries to our country of interest; Ghana. Holding all the other parts constant as before, and changing only the boundary code, we have ;
# A function to clip the image collection to the area of interest
def func_onv(img):
    return img.clip(ghanaBorder)

dust_test = dust.map(func_onv)
dustImage = dust.mean()# find the mean image(to be added to the map)
#Define the visualization parameter
val_max = 2.0
val_min = -1
band_viz = {
  'min': val_min,
  'max': val_max,
  'opacity': 0.55,
  'palette': ["#000000", "#0000FF", "#800080", "#00FFFF", "4C9A2A", "#FFFF00", "#FF0000"]
}

# Now map the visualization parameters over the collection
def func_cyl(image):
    return image.visualize(band_viz) \
  .map(func_cyl)
Display the mean image on the map
 Map = geemap.Map()# Define an empty
 legend_dict = {"-1": "#000000", "-0.5":"#0000FF",
               "0" :"#800080", "0.5": "#00FFFF",
               "1":"4C9A2A", "1.5": "#FFFF00",
               "2": "#FF0000"} #Map legend
clippedImage = dustImage.clip(ghanaBorder)
Map.centerObject(ghanaBorder,6)
Map.addLayer(clippedImage, band_viz, 'Clipped Image'); # Add image to the map
Map.add_basemap('HYBRID')

Map.add_legend(legend_title= "Aerosol index",legend_dict=legend_dict)
Map.addLayerControl()
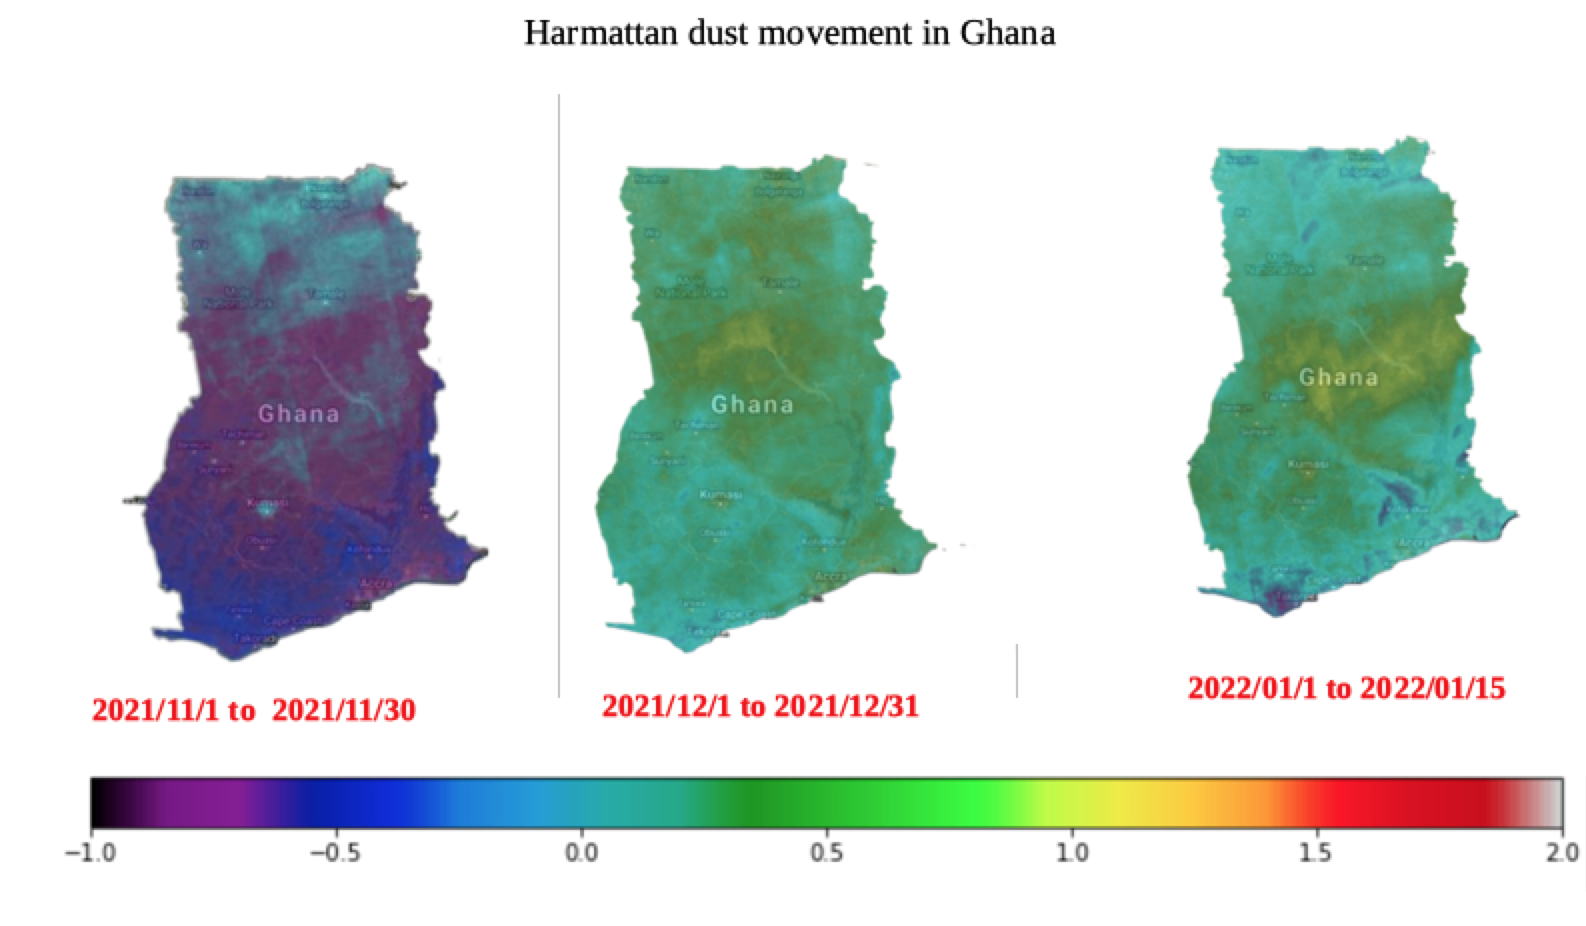
Monitoring the movement of dust from the begining of harmattan season (first image) to the current date (third image) we see that the amount of dust associaeted with harmattan is very minimal with exception of the northern sector at the begining of the season. As we progress barely a month into the harmattan, we observe a larger amount of dust over the entire country (second image). Finaly, the last image gives an idea of the intensity of harmattan in the country(especially around the middle sector) .
 We are going to travel back in time, to see how the country looks like in terms of dust composition before harmattan. To do this, we collect satellite images a month before the season.
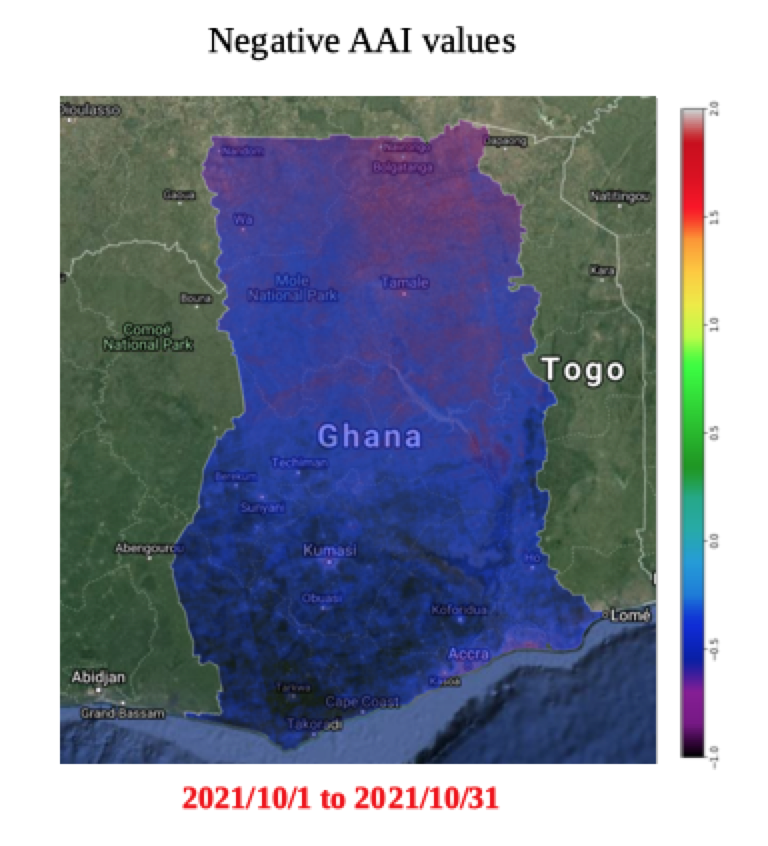
Clearly, we record negative values for aerosol absorbing index(AAI). From all the satellite images available for the month of October, we observe negative aerosol absorbing index as such we conclude the absence of harmattan associated dust prior to the harmattan season.
Important info
We acknowledge that the use of satellite images alone such as AAI is not adequate to disaggregate dust into various particulate mattar (PM 2.5 and PM 10), as a result, readers and researchers interested in indepth analysis involving particulate matter need to augment their data source with ground based sensors such as The Real-time, Affordable, Multi-Pollutant (RAMP).
Thank you for reading. Feel free to comment or ask any question you have.
Hi. I am Bright Aboh; a data scientist, a climate change researcher and a music lover.